Showing posts with label cold. Show all posts

Saturday, February 3, 2018

Is warming in the Arctic behind this year's crazy winter weather?

Is warming in the Arctic behind this year's crazy winter weather?

File 20180111 101511 sa3hd1.jpg?ixlib=rb 1.1
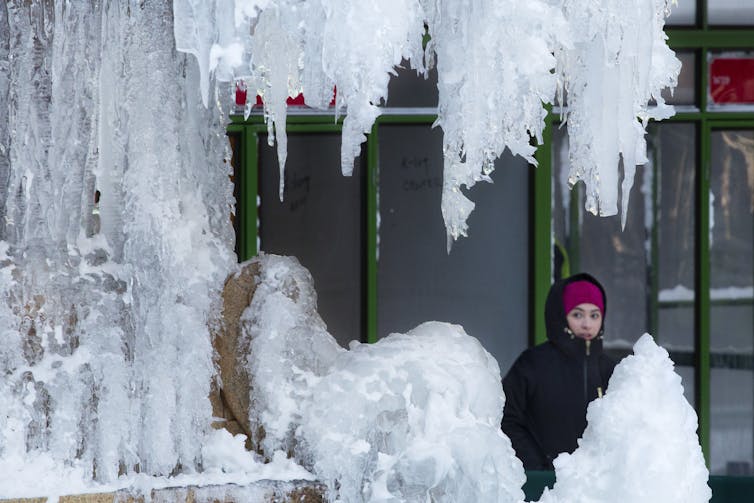
Seriously cold: The ‘bomb cyclone’ freezes a fountain in New York City.
AP Photo/Mark Lennihan
Jennifer Francis, Rutgers University

Damage from extreme weather events during 2017 racked up the biggest-ever bills for the U.S. Most of these events involved conditions that align intuitively with global warming: heat records, drought, wildfires, coastal flooding, hurricane damage and heavy rainfall.

Paradoxical, though, are possible ties between climate change and the recent spate of frigid weeks in eastern North America. A very new and “hot topic” in climate change research is the notion that rapid warming and wholesale melting of the Arctic may be playing a role in causing persistent cold spells.

It doesn’t take a stretch of the imagination to suppose that losing half the Arctic sea-ice cover in only 30 years might be wreaking havoc with the weather, but exactly how is not yet clear. As a research atmospheric scientist, I study how warming in the Arctic is affecting temperature regions around the world. Can we say changes to the Arctic driven by global warming have had a role in the freakish winter weather North America has experienced?

A ‘dipole’ of abnormal temperatures

Weird and destructive weather was in the news almost constantly during 2017, and 2018 seems to be following the same script. Most U.S. Easterners shivered their way through the end of 2017 into the New Year, while Westerners longed for rain to dampen parched soils and extinguish wildfires. Blizzards have plagued the Eastern Seaboard – notably the “bomb cyclone” storm on Jan. 4, 2018 – while California’s Sierra Nevada stand nearly bare of snow.
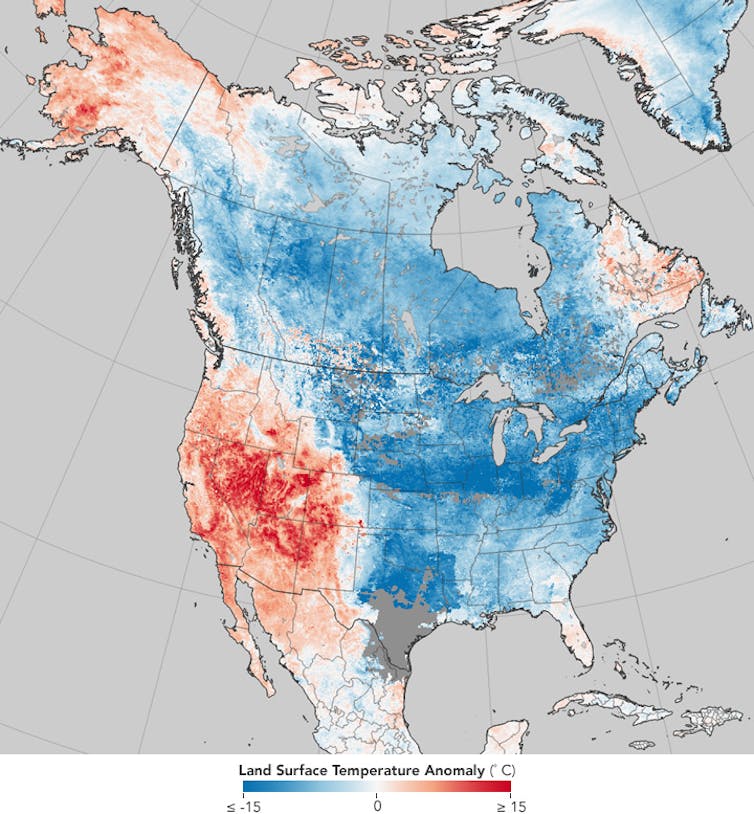
A study in contrasts: Warming near Alaska and the Pacific Ocean are ‘ingredients’ to a weather pattern where cold air from the Arctic plunges deep into North America.
NASA Earth Observatory, CC BY
This story is becoming a familiar one, as similar conditions have played out in four of the past five winters. Some politicians in Washington D.C., including President Trump, have used the unusual cold to question global warming. But if they looked at the big picture, they’d see that eastern cold spells are a relative fluke in the Northern Hemisphere as a whole and that most areas are warmer than normal.

A warm, dry western North America occurring in combination with a cold, snowy east is not unusual, but the prevalence and persistence of this pattern in recent years have piqued the interests of climate researchers.

The jet stream – a fast, upper-level river of wind that encircles the Northern Hemisphere – plays a critical role. When the jet stream swoops far north and south in a big wave, extreme conditions can result. During the past few weeks, a big swing northward, forming what’s called a “ridge” of persistent atmospheric pressure, persisted off the West Coast along with a deep southward dip, or a “trough,” over the East.

New terms have been coined to describe these stubborn features: “The North American Winter Temperature Dipole,” the “Ridiculously Resilient Ridge” over the West, and the “Terribly Tenacious Trough” in the East.
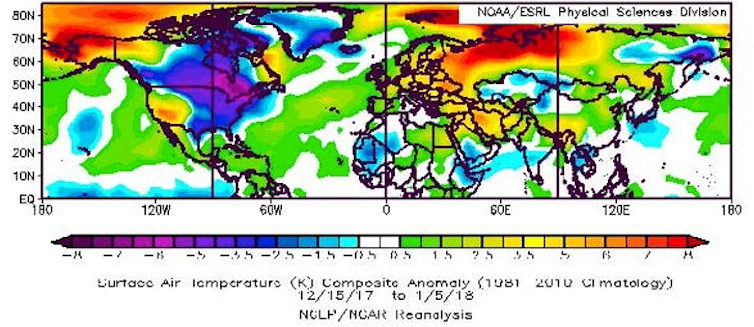
While the eastern U.S. suffered very cold temperatures in the recent cold snap, much of the rest of the Northern Hemisphere saw higher-than-average air temperatures.
NOAA, CC BY

Regardless what it’s called, this dipole pattern – abnormally high temperatures over much of the West along with chilly conditions in the East – has dominated North American weather in four of the past five winters. January 2017 was a stark exception, when a strong El Niño flipped the ridge-trough pattern, dumping record-breaking rain and snowpack on California while the east enjoyed a mild month.

Two other important features are conspicuous in the dipole temperature pattern: extremely warm temperatures in the Arctic near Alaska and warm ocean temperatures in the eastern Pacific. Several new studies point to these “ingredients” as key to the recent years with a persistent dipole.

It takes two to tango

What role does warming – specifically the warming ocean and air temperatures in the Arctic – play in this warm-West/cool-East weather pattern? The explanation goes like this.

Pacific Ocean temperatures fluctuate naturally owing to short-lived phenomena such as El Niño/La Niña and longer, decades-length patterns. Scientists have long recognized that those variations affect weather patterns across North America and beyond.
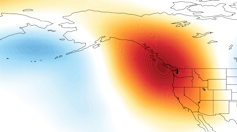
When a persistent area of atmospheric pressure stays in the western U.S., air from the Arctic pours into the U.S, causing a split between the warm and dry West and the cold East.
Mesocyclone2014 and David Swain, CC BY-SA

The new twist in this story is that the Arctic has been warming at at least double the pace of the rest of the globe, meaning that the difference in temperature between the Arctic and areas farther south has been shrinking. This matters because the north/south temperature difference is one of the main drivers of the jet stream. The jet stream creates the high- and low-pressure systems that dictate our blue skies and storminess while also steering them. Anything that affects the jet stream will also affect our weather.

When ocean temperatures off the West Coast of North America are warmer than normal, as they have been most of the time since winter 2013, the jet stream tends to form a ridge of high pressure along the West Coast, causing storms to be diverted away from California and leaving much of the West high and dry.

If these warm ocean temperatures occur in combination with abnormally warm conditions near Alaska, the extra heat from the Arctic can intensify the ridge, causing it to reach farther northward, become more persistent, and pump even more heat into the region near Alaska. And in recent years, Alaska has experienced periods of record warm temperatures, owing in part to reduced sea ice.

My colleagues and I have called this combination of natural and climate change-related effects “It Takes Two to Tango,” a concept that may help explain the Ridiculously Resilient Ridge observed frequently since 2013. Several new studies support this human-caused boost of a natural pattern, though controversy still exists regarding the mechanisms linking rapid Arctic warming with weather patterns farther south in the mid-latitudes.

More extreme weather ahead?

In response to the strengthened western ridge of atmospheric pressure, the winds of the jet stream usually also form a deeper, stronger trough downstream. Deep troughs act like an open refrigerator door, allowing frigid Arctic air to plunge southward, bringing misery to areas ill-prepared to handle it. Snowstorms in Texas, ice storms in Georgia and chilly snowbirds in Florida can all be blamed on the Terribly Tenacious Trough of December 2017 and January 2018.
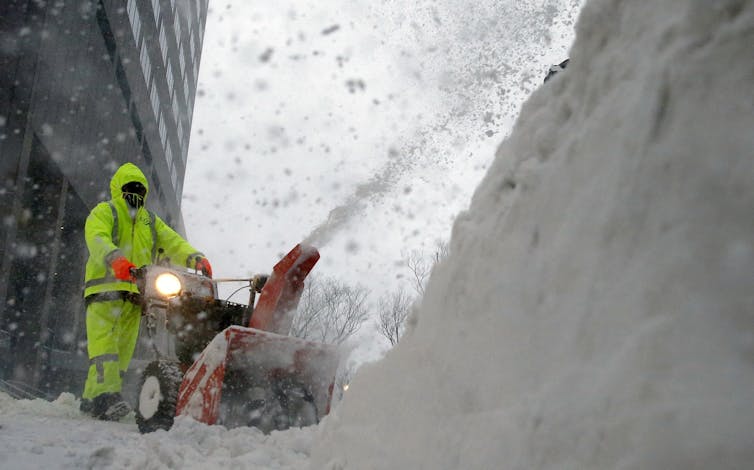
Cold weather from the Arctic combined with warm tropical air fueled a storm that produced well over a foot of snow and spots of flooding in Boston.
AP Photo/Michael Dwyer
Adding icing on the cake is the tendency for so-called “nor’easters,” such as the “bomb cyclone” that struck on Jan. 4, to form along the East Coast when the trough’s southwest winds align along the Atlantic Seaboard. The resulting intense contrast in temperature between the cold land and Gulf Stream-warmed ocean provides the fuel for these ferocious storms.

The big question is whether climate change will make dipole patterns – along with their attendant tendencies to produce extreme weather – more common in the future. The answer is yes and no.

It is widely expected that global warming will produce fewer low-temperature records, a tendency already observed. But it may also be true that cold spells will become more persistent as dipole patterns intensify, a tendency that also seems to be occurring.

It’s hard to nail down whether this weather pattern – overall warmer winters in North America but longer cold snaps – will persist. Understanding the mechanisms behind these complex interactions between natural influences and human-caused changes is challenging.

The ConversationNevertheless, research is moving forward rapidly as creative new metrics are developed. Our best tools for looking into the future are sophisticated computer programs, but they, too, struggle to simulate these complicated behaviors of the climate system. Given the importance of predicting extreme weather and its impacts on many aspects of our lives, researchers must continue to unravel connections between climate change and weather to help us prepare for the likely ongoing tantrums by Mother Nature.

Jennifer Francis, Research Professor, Rutgers University

This article was originally published on The Conversation. Read the original article.

Tuesday, February 4, 2014

As continental U.S. freezes, Alaska gets record high temperatures

While much of the continental United States endured several cold snaps in January 2014, record-breaking warmth gripped Alaska. Spring-like conditions set rivers rising and avalanches tumbling. NASA Eartobservatory illustrates the above words with the two images below.


Above map depicts land surface temperature anomalies in Alaska for January 23–30, 2014. Based on data from the Moderate Resolution Imaging Spectroradiometer (MODIS) on NASA’s Terra satellite, the map shows how 2014 temperatures compared to the 2001–2010 average for the same week. Areas with warmer than average temperatures are shown in red; near-normal temperatures are white; and areas that were cooler than the base period are blue. Gray indicates oceans or areas where clouds blocked the satellite from collecting usable data.

A persistent ridge of high pressure off the Pacific Coast fueled the warm spell, shunting warm air and rainstorms to Alaska instead of California, where they normally end up. The last half of January was one of the warmest winter periods in Alaska’s history, with temperatures as much as 40°F (22°C) above normal on some days in the central and western portions of the state, according to Weather Underground’s Christopher Bart. The all-time warmest January temperature ever observed in Alaska was tied on January 27 when the temperature peaked at 62°F (16.7°C) at Port Alsworth. Numerous other locations—including Nome, Denali Park Headquarters, Palmer, Homer, Alyseka, Seward, Talkeetna, and Kotzebue—all set January records.

The combination of heat and rain has caused Alaska’s rivers to swell and brighten with sediment, creating satellite views reminiscent of spring and summer runoff. On January 25, 2014, the Aqua satellite collected this image of sediment flowing into the Gulf of Alaska from numerous rivers along the state’s southeastern coast.

All of the heat, moisture, and melting snow has elevated the risk of avalanches. A series of extremely large avalanches in late January sent snow and debris crashing onto the Richardson Highway, blocking the road and cutting the port town of Valdez off from highway access. The avalanches dumped a mound of snow 100 feet (30 meters) tall and up to 1,500 feet (460 meters) long on the highway.


Below are two videos with forecasts for the period from February 4, 2014, to February 11, 2014. The top video shows temperature forecasts and the bottom video shows temperature anomaly forecasts.

Thursday, January 30, 2014

Forecast: America to be hit by temperatures as low as minus 40 degrees

The image on the right shows that large parts of North America, the Arctic Ocean and Siberia are experiencing low temperatures.

What many people may not realize is that temperatures in the Arctic are actually a lot higher than they used to be around this time of year.

Temperatures in the Arctic have risen due to feedbacks as described in the post The Biggest Story of 2013.

As a result, temperature anomalies above 20 degrees Celsius now feature in the Arctic. As the image on the right illustrates, the once-common temperature difference between the Arctic and lower latitudes has been shattered, and this is weakening the Jet Stream and the Polar Vortex, in turn making it easier for cold air to flow down to lower latitudes and for warmer air to enter the Arctic, as described in posts at this blog for years, e.g. this post.

This is illustrated by the image below, showing that the Arctic is hit by an overall temperature anomaly of 6.55 degrees Celsius, while some areas in the Arctic feature anomalies above 20 degrees Celsius.


Forecasts show that on February 2nd, 2014, 1200 UTC, the Arctic will be hit by a temperature anomaly of 7.85 degrees Celsius, while on February 6th, 2014, 1200 UTC, the U.S. will be hit by temperatures as low as -40 degrees, as illustrated by the image below.


The video below shows temperature forecasts from February 1to February 8, 2014.


The video below shows temperatire anomalies from February 2 to February 9, 2014.


Meanwhile, the Gulf Stream keeps pushing warm water into the Arctic Ocean, as illustrated by the image below.

Click on image to enlarge - view updated animation at earth.nullschool.net 
The image below shows how high sea surface temperature anomalies stretch out from the point where the Gulf Stream travels at high speeds, off the coast of North America, all the way into the Arctic Ocean.


This has already resulted in methane eruptions from the seafloor of the Arctic Ocean that started several months ago and are continuing to date - ominous signs of more to come. The image below, which compares peak methane levels at two altitudes between January 2013 and January 2014, suggests that January 2014 peak levels have increased strongly, compared to January 2013 peak levels. Furthermore, that the rise in average peak readings has been most dramatic at the higher altitude.


This suggests that huge quantities of methane have indeed been released from hydrates under the Arctic ocean, and that much of the methane is rising and building up at higher altitudes. The increasing appearance of noctilucent clouds further confirms indications that methane concentrations are rising at higher altitudes.

Of course, the above analysis uses a limited dataset, but if verified by further analysis, it would confirm a dramatic rise in the presence of methane in the atmosphere due to releases from hydrates. Moreover, it would confirm the immensity of threat that releases from the Arctic Ocean will escalate and trigger runaway warming, as high methane concentrations over the Arctic are contributing to the anomalously high temperatures there. The risk that this will eventuate is unacceptable, which calls for comprehensive and effective action such as discussed at the ClimatePlan blog.