Showing posts with label Greenland. Show all posts

Tuesday, July 30, 2019

Arctic Sea Ice Gone By September 2019?

Record low Arctic sea ice extent for the time of year


Arctic sea ice minimum extent typically occurs about half September. In 2012, minimum extent was reached on September 17, 2012, when extent was 3.387 million km².

On July 28, 2019, Arctic sea ice extent was 6.576 million km². How much extent do you think there will be by September 17, 2019? From July 28, 2019, to September 17, 2019, that's a period of 52 days during which a lot of melting can occur. Could there be a Blue Ocean Event in 2019, with virtually all sea ice disappearing in the Arctic?

Consider this. Extent was 6.926 million km² on September 17, 1989. Extent was 3.387 million km² on September 17, 2012, so 3.539 million km² had disappeared in 23 years. Over those years, more ice extent disappeared than what was left on September 17, 2012.

The question is how much sea ice extent will be left when it will reach its minimum this year, i.e. in September 2019. The red dashed line on the image at the top continues the path of the recent fall in sea ice extent, pointing at zero Arctic sea ice extent in September 2019. Progress is followed at this post.

Zero Arctic sea ice in 2019

Zero Arctic sea ice in 2019 sounds alarming, and there is good reason to be alarmed.


Above map shows temperatures on Greenland on July 31, 2019, with temperatures at one location as high as 23.2°C or 73.8°F and at another location - in the north - as high as 14.2°C or 57.6°F.

The map on the right shows sea surface temperature anomalies compared to 1961-1990 as on July 29, 2019. Note the high anomalies in the areas where the sea ice did disappear during the past few months. The reason for these high anomalies is that the buffer has disappeared that previously had kept consuming heat in the process of melting.

Where that buffer is gone, the heat has to go somewhere else, so it will be absorbed by the water and it will also speed up heating of the atmosphere over the Arctic.

Sea ice melting is accelerating for a number of reasons:
  • Ocean Heat - Much of the melting of the sea ice occurs from below and is caused by heat arriving in the Arctic Ocean from the Atlantic Ocean and the Pacific Ocean. 
  • Direct Sunlight - Hot air will melt the ice from above and this kind of melting can increase strongly due to changing wind patterns. 
  • Rivers - Heatwaves over land can extend over the Arctic Ocean and they also heat up river water flowing into the Arctic Ocean.
  • Fires - Changing wind patterns can also increase the intensity and duration of such heatwaves that can also come with fires resulting in huge amounts of greenhouse gas emissions, thus further speeding up the temperature rise, and also resulting in huge emissions of soot that, when settling on sea ice, speeds up melting (see images below). 
  • Numerous feedbacks will further speed up melting. Heating is changing the texture of the sea ice at the top and is making melt pools appear, both of which cause darkening of the surface. Some further feedbacks, i.e. storms and clouds are discussed below in more detail. 

Above combination image shows smoke from fires in Siberia getting pushed over the Laptev Sea on August 11, 2019, due to cyclonic winds over the Arctic Ocean. This was also discussed in an earlier post. The image below shows the situation on August 12, 2019.


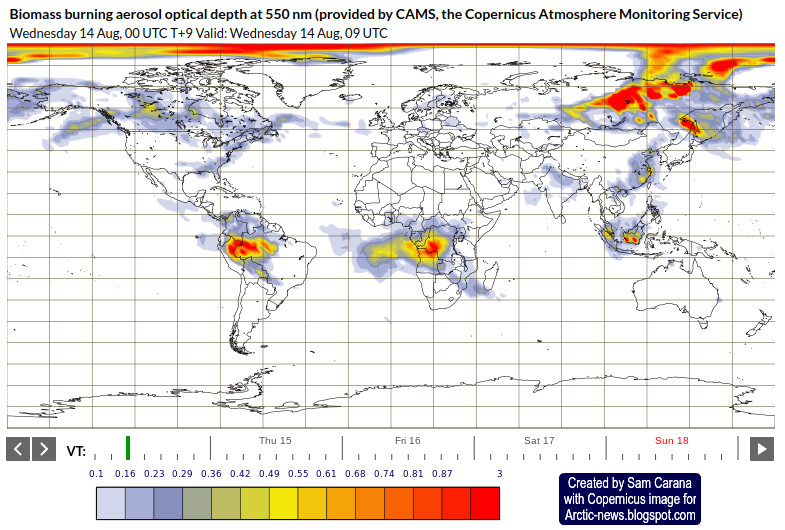
The image below shows the situation on August 14, 2019.


In the video below, Paul Beckwith discusses the situation.


In the video below, Paul Beckwith discusses the heating impact of albedo loss due to Arctic sea ice loss, including the calculations in a recent paper.


As the Arctic is heating up faster than the rest of the world, it is also more strongly affected by the resulting extreme weather events, such as heatwaves, fires, strong winds, rain and hail storms, and such events can strongly speed up the melting of the sea ice.


All around Greenland, sea ice has now virtually disappeared. This is the more alarming considering that the thickest sea ice was once located north of Greenland. This indicates that the buffer is almost gone.

Why is disappearance of Arctic sea ice so important? Hand in hand with albedo loss as the sea ice disappears, there is loss of the buffer (feedbacks #1, #14 and more). As long as there is sea ice in the water, this sea ice will keep absorbing heat as it melts, so the temperature will not rise at the sea surface. The amount of energy absorbed by melting ice is as much as it takes to heat an equivalent mass of water from zero to 80°C.


Once the sea ice is gone, further heat must go elsewhere. This heat will raise the temperature of the water and will also make the atmosphere heat up faster.

Storms and Clouds

Storms: As temperatures in the Arctic are rising faster than at the Equator, the Jet Stream is changing, making it easier for warm air to enter the Arctic and for cold air to descend over continents that can thus become much colder than the oceans, and this stronger temperature difference fuels storms.

Clouds: More evaporation will occur as the sea ice disappears, thus further heating up the atmosphere (technically know as latent heat of vaporization).

In the video below, Paul Beckwith further discusses Arctic albedo change and clouds.


Disappearance of the sea ice causes more clouds to form over the Arctic. This on the one hand makes that more sunlight gets reflected back into space. On the other hand, this also make that less outward infrared radiation can escape into space. The net effect of more clouds is that they are likely cause further heating of the air over the Arctic Ocean (feedbacks #23 and #25).

More low-altitude clouds will reflect more sunlight back into space, and this occurs most during Summer when there is most sunshine over the Arctic. The image below, a forecast for August 17, 2019, shows rain over the Arctic. Indeed, more clouds in Summer can also mean rain, which can devastate sea ice, as discussed in an earlier post.


Regarding less outward radiation, the IPCC has long warned, e.g. in TAR, about a reduction in outgoing longwave radiation (OLR): "An increase in water vapour reduces the OLR only if it occurs at an altitude where the temperature is lower than the ground temperature, and the impact grows sharply as the temperature difference increases."

While reduction in OLR due to water vapor is occurring all year long, the impact is particularly felt in the Arctic in Winter when the air is much colder than the surface. In other words, less OLR makes Arctic sea ice thinner, especially in Winter.

The inflow of ocean heat into the Arctic Ocean can increase strongly as winds increase in intensity. Storms can push huge amounts of hot, salty water into the Arctic Ocean, as discussed earlier, such as in this post and this post. As also described at the extreme weather page, stronger storms in Winter will push more ocean heat from the Atlantic toward the Arctic Ocean, further contributing to Arctic sea ice thinning in Winter.

Seafloor Methane


[ The Buffer has gone, feedbacks #14 and #16 ]

As the buffer disappears that until now has consumed huge amounts of heat, the temperature of the water of the Arctic Ocean will rise even more rapidly, with the danger that further heat will reach methane hydrates at the seafloor of the Arctic Ocean, causing them to get destabilized and release huge amounts of methane (feedback #16).

Ominously, high methane levels were recorded at Barrow, Alaska, at the end of July 2019, as above image shows.


[ from an earlier post ]
And ominously, a mean global methane level as high as 1902 ppb was recorded by the MetOp-1 satellite in the afternoon of July 31, 2019, as above image shows.

As the image on the right shows, mean global levels of methane (CH₄) have risen much faster than carbon dioxide (CO₂) and nitrous oxide (N₂O), in 2017 reaching, respectively, 257%, 146% and 122% their 1750 levels.

Temperature Rise

Huge releases of seafloor methane alone could make marine stratus clouds disappear, as described in an earlier post, and this clouds feedback could cause a further 8°C global temperature rise.

Indeed, a rapid temperature rise of as much as 18°C could result by the year 2026 due to a combination of elements, including albedo changes, loss of sulfate cooling, and methane released from destabilizing hydrates contained in sediments at the seafloor of oceans.

[ from an earlier post ]

Below is Malcolm Light's updated Extinction Diagram.

[ click on images to enlarge ]
The situation is dire and calls for comprehensive and effective action, as described in the Climate Plan.


Link

• Climate Plan
https://arctic-news.blogspot.com/p/climateplan.html

• Smoke Covers Much Of Siberia
https://arctic-news.blogspot.com/2019/07/smoke-covers-much-of-siberia.html

• Extreme Weather
https://arctic-news.blogspot.com/p/extreme-weather.html

• Albedo and more
https://arctic-news.blogspot.com/p/albedo.html

• Radiative Heating of an Ice‐Free Arctic Ocean, by Kristina Pistone et al. (2019)
https://agupubs.onlinelibrary.wiley.com/doi/10.1029/2019GL082914

• High cloud coverage over melted areas dominates the impact of clouds on the albedo feedback in the Arctic, by Min He et al. (2019)
https://www.nature.com/articles/s41598-019-44155-w

• ESD Reviews: Climate feedbacks in the Earth system and prospects for their evaluation, by Christoph Heinze et al. (2019)
https://www.earth-syst-dynam.net/10/379/2019/esd-10-379-2019-discussion.html

• Contribution of sea ice albedo and insulation effects to Arctic amplification in the EC-Earth Pliocene simulation, by Jianqiu Zheng et al. (2019)
https://www.clim-past.net/15/291/2019

• Far-infrared surface emissivity and climate, by Daniel Feldman et al. (2014)
https://www.pnas.org/content/111/46/16297.abstract

• Extreme Weather
https://arctic-news.blogspot.com/p/extreme-weather.html

• Feedbacks in the Arctic
https://arctic-news.blogspot.com/p/feedbacks.html

• Rain Storms Devastate Arctic Ice And Glaciers
https://arctic-news.blogspot.com/2015/01/rain-storms-devastate-arctic-ice-and-glaciers.html

• A rise of 18°C or 32.4°F by 2026?
https://arctic-news.blogspot.com/2019/02/a-rise-of-18c-or-324f-by-2026.html

• As El Niño sets in, will global biodiversity collapse in 2019?
https://arctic-news.blogspot.com/2018/11/as-el-nino-sets-in-will-global-biodiversity-collapse-in-2019.html

• Dangerous situation in Arctic
https://arctic-news.blogspot.com/2018/11/dangerous-situation-in-arctic.html

• Warning of mass extinction of species, including humans, within one decade
https://arctic-news.blogspot.com/2017/02/warning-of-mass-extinction-of-species-including-humans-within-one-decade.html


Friday, June 21, 2019

Beyond climate tipping points

Beyond climate tipping points
Greenhouse gas levels exceed the stability limit of the
Greenland and Antarctic ice sheets

by Andrew Glikson

Abstract

The pace of global warming has been grossly underestimated. As the world keeps increasing its carbon dioxide (CO₂) emissions, rising in 2018 to a record 33.1 billion ton of CO₂ per year, the atmospheric greenhouse gas level has now exceeded 560 ppm (parts per million) CO-equivalent, namely when methane and nitrous oxide are included. This level surpasses the stability threshold of the Greenland and Antarctic ice sheets. The term “climate change” is thus no longer appropriate, since what is happening in the atmosphere-ocean system, accelerating over the last 70 years or so, is an abrupt calamity on a geological dimension, threatening nature and human civilization. Ignoring what the science says, the powers-that-be are presiding over the sixth mass extinction of species, including humanity.

As conveyed by leading scientists “Climate change is now reaching the end-game, where very soon humanity must choose between taking unprecedented action, or accepting that it has been left too late and bear the consequences” (Prof. Hans Joachim Schellnhuber) ... “We’ve reached a point where we have a crisis, an emergency, but people don’t know that ... There’s a big gap between what’s understood about global warming by the scientific community and what is known by the public and policymakers” (Prof. James Hansen).


Rising greenhouse gases and temperatures

By May 2019 CO₂ levels (measured at Mauna Loa, Hawaii) reached 414.66 ppm, growing at a rate of 3.42 ppm/year, well above the highest rate recorded for the last 65 million years. The total CO, methane (CH) and nitrous oxide (NO) expressed as CO-equivalents has reached at least 560.3 ppm (Table 1) (at a very low forcing value for methane ¹), the highest concentration since 34 - 23 Million years ago, when atmospheric CO ranged between 350 and 500 ppm.

Table 1. Total atmospheric CO2e from CO2, CH4 and N2O
CO2
CO2 rate
CH4
CH4 rate
N2O
414.66 ppm 
3.42 ppm/year
1865.4 ppb
9.2 ppm/year
332ppb
CO2 ppm 
rise/year
CH4 forcing ≥25 CO2e
CH4 ppb
rise/year
N2O forcing = 298 CO2e
CO2 ppm 
414.7

CH4 ppm forcing
1.865 x ≥25 =
46.6 ppm CO2e 
(equivalent)

N2O ppm forcing
0.332 x 298 =
99 ppm CO2e 
(equivalent)

Total CO2e: 414.7+46.6+99 = >560.3 ppm CO2
¹A methane forcing value of 25 x CO2 is very low. Higher forcing values are more appropriate.
Plus: SF₆, CHF3, CH2F2, CF4, C2F6, C3F8, C4F10, C4F8, C5F12, C6F1


Figure 1. Projected CO₂ levels for IPCC emission scenarios

The current rise of the total greenhouse gas levels to at least 560 ppm CO-equivalent, twice the pre-industrial CO2 level of 280 ppm, implies that global warming has potentially reached +2°C to +3°C above pre-industral temperature. Considering the mitigating albedo/reflection effects of atmospheric aerosols, including sulphur dioxide, dust, nitrate and organic carbon, the mean rise of land temperature exceeds +1.5°C (Berkeley Earth institute).

The threshold for collapse of the Greenland ice sheet is estimated in the range of 400-560 ppm CO₂ at approximately 2.0 - 2.5 degrees Celsius above pre-industrial temperatures, and is retarded by hysteresis (where a physical property lags behind changes in the effect causing it). The threshold for the breakdown of the West Antarctic ice sheet is similar. The greenhouse gas level and temperature conditions under which the East Antarctic ice sheet formed about 34 million years ago are estimated as ~800–2000 ppm at 4 to 6 degrees Celsius above pre-industrial values. Based mainly on satellite gravity data there is evidence the East Antarctic ice sheet is beginning to melt in places (Jones, 2019), with ice loss rates of approximately 40 Gt/y (Gigaton of ice per year) in 1979–1990 and up to to 252 Gt/y in 2009–2017 (Rignot et al., 2019).

The cumulative contribution to sea-level rise from Antarctic ice melt was 14.0 ± 2.0 mm since 1979. This includes 6.9 ± 0.6 mm from West Antarctica, 4.4 ± 0.9 mm from East Antarctica, and 2.5 ± 0.4 mm from the Antarctic Peninsula (Rignot et al., 2019). Based on the above the current CO-equivalent level of at least 560 ppm closely correlates with the temperature peak at ~16 million tears ago (Figures 2 and 5), when the Greenland ice sheet did not exist and large variations affected the Antarctic ice sheet (Gasson et al., 2016).

Figure 2. Updated Cenozoic pCO₂ and stacked deep-sea benthic foraminifer oxygen isotope curve for 0 to
65 Ma (Zachos et al., 2008) converted to the Gradstein timescale (Gradstein et al., 2004).
ETM2 = Eocene Thermal Maximum 2, PETM = Paleocene/Eocene Thermal Maximum.

Transient melt events

As the glacial sheets disintegrate, cold ice-melt water flowing into the ocean ensue in large cold water pools, a pattern recorded through the glacial-interglacial cycles of the last 450,000 years, manifested by the growth of cold regions in the north Atlantic Ocean south of Greenland and in the Southern Ocean fringing Antarctica (Figures 3 and 4). The warming of the Arctic is driven by the ice-water albedo flip (where dark sea-water absorbing solar energy alternate with high-albedo ice and snow) and by the weakening of the polar boundary and jet stream. Penetration of Arctic-derived cold air masses through the weakened boundary results in extreme weather events in North America, Europe and northern Asia, such as the Beast from the East event.

Warming of +3°C to +4°C above pre-industrial levels, leading to enhanced ice-sheet melt, would raise sea levels by 2 to 5 meters toward the end of the century, and likely by 25 meters in the longer term. Golledge et al. (2019) show meltwater from Greenland will lead to substantial slowing of the Atlantic overturning circulation, while meltwater from Antarctica will trap warm water below the sea surface, increasing Antarctic ice loss. The effects of ice sheet-melt waters on the oceans were hardly included in IPCC models. Depending on the amplifying feedbacks, prolonged Greenland and Antarctic melting (Figures 3 and 4) and a consequent freeze event may ensue, lasting perhaps as long as two to three centuries.


Figure 3. (A) Global warming map (NASA 2018). Note the cool ocean regions south of Greenland
and along the Antarctic. Credits: Scientific Visualization Studio/Goddard Space Flight Center;
(B) 2012 Ocean temperatures around Antarctica, (NASA 2012).

21st–23rd centuries uncharted climate territory

Modelling of climate trends for the 2100-2300 by the IPCC AR5 Synthesis Report, 2014 portrays predominantly linear models of greenhouse gas rise, global temperatures and sea levels. These models however appear to take little account of amplifying feedbacks from land and ocean and of the effects of cold ice-melt water on the oceans. According to Steffen et al. (2018) “self-reinforcing feedbacks could push the Earth System toward a planetary threshold” and “would lead to a much higher global average temperature than any interglacial in the past 1.2 million years and to sea levels significantly higher than at any time in the Holocene”.

Amplifying feedbacks of global warming include:
  • The albedo-flip in melting sea ice and ice sheets and the increase of the water surface area and thereby the sequestration of CO₂. Hudson (2011) estimates a rise in radiative forcing due to removal of Arctic summer sea ice of 0.7 Watt/m², a value close to the total of methane release since 1750.
  • Reduced ocean CO₂ intake due to lesser solubility of the gas with higher temperatures.
  • Vegetation desiccation and loss in some regions, and thereby reduced evaporation with its cooling effect. This factor and the increase of precipitation in other regions lead to a differential feedbacks from vegetation as the globe warms (Notaro et al. 2007).
  • An increase in wildfires, releasing greenhouse gases.
  • Release of methane from permafrost, bogs and sediments and other factors.
Linear temperature models do not appear to take into account the effects on the oceans of ice melt water derived from the large ice sheets, including the possibility of a major stadial event such as already started in oceanic tracts fringing Greenland and Antarctica (Figure 3). In the shorter term sea level rises include the Greenland ice sheet (6-7 meter sea level rise) and West Antarctic ice sheet melt (4.8 meter sea level rise). Referring to major past stadial events, including the 8200 years-old Laurentian melt event and the 12.7-11.9 younger dryas event, a prolonged breakdown of parts of the Antarctic ice sheet could result in major sea level rise and extensive cooling of northern and southern latitudes, parallel with warming of tropical and mid-latitudes (Figure 4) (Hansen et al., 2016). The clashes between polar-derived cold weather fronts and tropical air masses are bound to lead to extreme weather events, echoed in Storms of my grandchildren (Hansen, 2010).

Figure 4. Model Surface-air temperature (°C) for 2096 relative to 1880–1920 (Hansen et al. 2016).
The projection portrays major cooling of the North Atlantic Ocean, cooling of the circum-Antarctic Ocean 

and further warming in the tropics, subtropics and the interior of continents, including Siberia and Canada.

Summary and conclusions
  1. Global greenhouse gases have reached a level exceeding the stability threshold of the Greenland and Antarctic ice sheets, melting at an accelerated rate
  2. The current growth rate of atmospheric greenhouse gas of 3.42 ppm CO₂/year is the fastest recorded for the last 55 million years
  3. Allowing for the transient albedo enhancing effects of sulphur dioxide and other aerosols, mean global temperature has reached about 2 degrees Celsius above pre-industrial temperatures. 
  4. Due to hysteresis the large ice sheets outlast their melting temperatures. 
  5. Cold ice melt water flowing from the ice sheets at an accelerated rate will reduce the temperature of large ocean tracts in the North Atlantic and circum-Antarctic. Strong temperature contrasts between cold polar-derived air and water masses and tropical air and water masses would result in extreme weather events, retarding agriculture in large parts of the world. 
  6. Humans will survive in relatively favorable parts of Earth, such as sub-polar regions and sheltered mountain valleys, where hunting of surviving fauna may be possible.
  7. In the wake of partial melting of the large ice sheets, the Earth climate would shift to polarized conditions including reduced polar ice sheets and tropical to super-tropical regions such as existed in the Miocene (5.3 - 23 million years ago) (Figure 5). 
Figure 5. Late Oligocene–Miocene inferred atmospheric CO2 fluctuations and effects on global temperature
based on Stromata index (SI) of 25 and 12 Ma (late Oligocene to late middle Miocene) fossil leaf remains;
(A) Reconstructed late Oligocene–middle Miocene CO2 levels based on individual independently
calibrated tree species; (B) Modeled temperature departure of global mean surface temperature from
present day, calculated from mean CO2 estimates by using a CO2–temperature sensitivity study. Red
discontinuous lines: 2019 CO2-e levels and 2019 temperatures (discounting the aerosol masking effects).
Current greenhouse gas forcing and global mean temperature are approaching Miocene Optimum-like composition, bar the hysteresis effects of reduced ice sheets (Figure 5). Strong temperature polarities are suggested by the contrasts between reduced Antarctic ice sheet and super-tropical conditions in low to mid-latitudes. Land areas would be markedly reduced due to a sea level rise of approximately 40 ± 15 meters.
Andrew Glikson


Dr Andrew Glikson
Earth and climate scientist
Australian National University
Canberra, Australian Territory, Australia
geospec@iinet.net.au

Books:
The Archaean: Geological and Geochemical Windows into the Early Earth
The Asteroid Impact Connection of Planetary Evolution
Asteroids Impacts, Crustal Evolution and Related Mineral Systems with Special Reference to Australia
Climate, Fire and Human Evolution: The Deep Time Dimensions of the Anthropocene
The Plutocene: Blueprints for a Post-Anthropocene Greenhouse Earth
Evolution of the Atmosphere, Fire and the Anthropocene Climate Event Horizon
From Stars to Brains: Milestones in the Planetary Evolution of Life and Intelligence

From Stars to Brains: Milestones in the Planetary Evolution of Life and Intelligence

The Plutocene: Blueprints for a Post-Anthropocene Greenhouse Earth

Added below is a video with an August 6, 2019, interview of Andrew Glikson by Guy McPherson and Kevin Hester, as edited by Tim Bob.


Sunday, June 16, 2019

High Temperatures over the Arctic


Melt extent over Greenland was well over 40% on June 12, 2019.

The surface melt map that day (on the right) shows many coastal areas for which data are missing, as indicated by the grey color.

As the June 13, 2019, NASA Worldview satellite image (underneath, right) shows, snow and ice in many coastal areas has melted away.

Four nullschool images are added below. The first one shows air temperatures over Greenland as high as 22.7°C or 72.9°F on June 13, 2019, at 1000 mb. Also note the high temperatures visible over East Siberia and the East Siberian Arctic Shelf (ESAS).

A second nullschool image shows that a temperature of 0.9°C or 33.5°F was recorded at the North Pole on June 15, 2019. Temperatures above the melting point of ice have been recorded at the North Pole for some time now.

The third nullschool image shows that temperatures as high as 30.5°C or 86.8°F are forecast for June 19, 2019, near Tiksi, which is on the coast of Siberia where the Lena River flows into the Laptev Sea and the Arctic Ocean.

What causes this? As the Arctic is heating up faster than the rest of the world, the path of the jet stream is changing. On June 19, 2019, the jet stream is forecast to move from Siberia to the Laptev Sea at speeds as high as 192 km/h or 119 mph.

The satellite image shows smoke from fires getting pushed by strong winds over the Laptev Sea on June 16, 2019. Smoke settling on ice makes it darker, further speeding up the melting.
[ Temperatures over Greenland as high as 22.7°C or 72.9°F on June 13, 2019, at 1000 mb ]
[ Temperature of 0.9°C or 33.5°F at the North Pole on June 15, 2019 ]
[ temperatures as high as 30.5°C or 86.8°F are forecast for June 19, 2019, near Tiksi, Siberia ]
[ jet stream is forecast to move from Siberia to the Laptev Sea as fast as at 192 km/h or 119 mph June 19, 2019 ]
[ fires getting pushed by strong winds on June 16, 2019, over the Laptev Sea (at bottom of image)  ]
In conclusion, temperatures over the Arctic are high. Changes to the jet stream due to the rapid heating of the Arctic are causing hot air to move deep into the Arctic, including over the Laptev Sea all the way to the North Pole, while high temperatures in Siberia are warming up the water of rivers, causing warm water to flow into the Arctic Ocean.  

The situation is dire and calls for comprehensive and effective action, as described in the Climate Plan.