Showing posts with label Antarctica. Show all posts

Friday, October 13, 2023

Temperature rise - September 2023 and beyond

The above image, adapted from NASA and the image below, adapted from Climate Reanalyzer and using the same baseline, illustrate the September 2023 temperature anomaly.


September 2023 was the month with the highest temperature anomaly on record. What contributed to this?
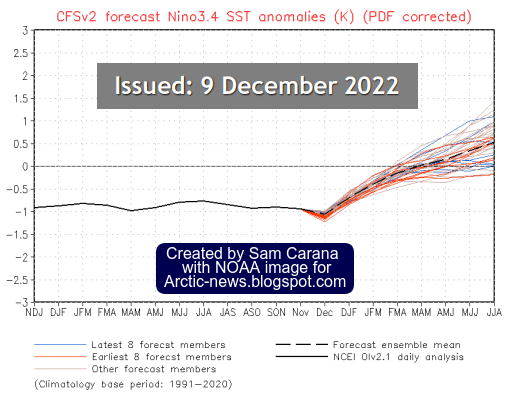
El Niño
 

The temperature rose about 0.5°C from November 2022 to March 2023, and this occurred at a time when we were not even in an El Niño yet, as illustrated by the above image, from an earlier post. Below is an updated image, from January 1950 to September 2023, adapted from NOAA

[ click on images to enlarge ]
[ click on images to enlarge ]
The current El Niño is still strengthening, as illustrated by the image on the right, adapted from IRI.

Further contributors

There are further reasons why the temperature can be expected to keep rising beyond September 2023.

The number of sunspots has been higher than predicted and looks set to keep rising above predicted levels until July 2025, as discussed here.

The eruption of the submarine volcano near Tonga in January 2022 caused a lot of water vapor to reach high up into the atmosphere and this may still contribute to the temperature rise, as discussed here.

Aerosols that have a cooling effect, such as dust and sulfates (SO₄), are also important. As fossil fuel is burned, sulfates are co-emitted. Since they pollute the air, measures have been taken and are being taken to reduce them, e.g. in shipping, and this has pushed up the temperature rise. Meanwhile, cooling aerosols such as sulfates are still high. As illustrated by the image below, adapted from nullschool.net, SO₄ was as high as 8.621 τ at the green circle on October 6, 2023, at 07:00 UTC. In future, SO₄ could fall dramatically, e.g. in case of a sudden economic collapse, reducing the aerosol masking effect rapidly and abruptly causing a substantial rise in temperature.


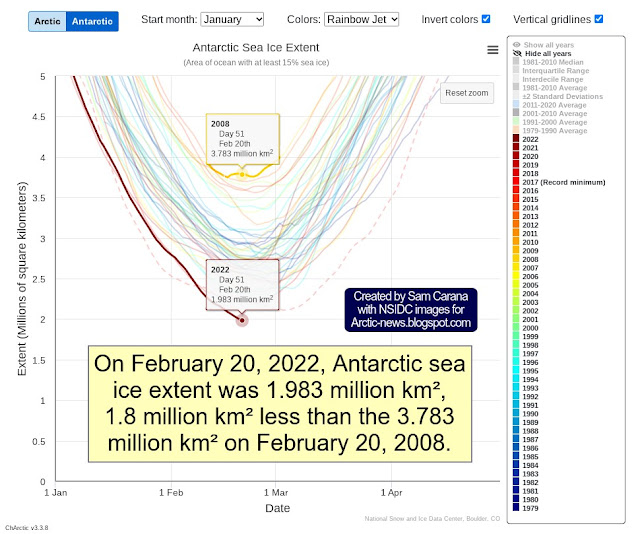
After little change in the Antarctic sea ice extent graph for decades, extent loss was dramatic in 2022 and even more dramatic in 2023, as less and less sunlight was getting reflected back into space and instead was getting absorbed by the water of the Southern Ocean, as illustrated by the image below, adapted from NSIDC.
Sea ice retreat comes with loss of albedo, i.e. loss of the amount of sunlight reflected back into space, resulting in more heat getting absorbed in the Southern Ocean, making it a self-reinforcing feedback loop. Clouds constitute another self-reinforcing feedback loop; a warmer Southern Ocean comes with fewer bright clouds, further reducing albedo, as discussed here and here. For decades, there still were many lower clouds over the Southern Ocean, reflecting much sunlight back into space, but these lower clouds have been decreasing over time, further speeding up the amount of sunlight getting absorbed by the water of the Southern Ocean, and this 'pattern effect' could make a huge difference globally, as a recent study points out. Emissivity is a further factor; open oceans are less efficient than sea ice when it comes to emitting in the far-infrared region of the spectrum (feedback #23 on the feedbacks page). 


The above image was created by Zach Labe with NSIDC data (Arctic + Antarctic) for each year from 1979 to 2023 (satellite-era; NSIDC, DMSP SSM/I-SSMIS). The image illustrates that global sea ice extent  recently reached the largest anomaly in the satellite record. Anomalies are calculated using a 5-day running mean from a climatological baseline of 1981-2010. 2016 is shown with a yellow line. 2023 is shown using a red line (updated 10/16/2023).

In the video below, Paul Beckwith discusses the importance of loss of sea ice at around -60° (South).


As said, there are many factors behind the temperature increase around latitude -60° (South). As Paul mentions, this latitude receives a lot of sunlight around the year. Therefore, it is not surprising that, as oceans continue to heat up, there is huge loss of sea ice at this latitude, as well as loss of lower clouds, while open oceans are additionally less efficient than sea ice when it comes to emitting in the far-infrared region of the spectrum. The image below, adapted from NASA, shows a white band around -60° (South), indicating that the Southern Ocean has long been colder there than elsewhere, but has recently started to catch up with the global temperature rise.


The above image also illustrates that anomalies are highest in the Arctic, narrowing the temperature difference between the Arctic and the Tropics, with the air flow slowing down accordingly. 

[ image adapted from Copernicus ]
This in turn changes the Jet Stream and the Polar Vortex, resulting in blocking patterns that can, in combination with rising temperatures, strongly increase the frequency, intensity, duration and area coverage of extreme weather events such as storms and lightning, heatwaves and forest fires.

Forest fires in Canada have been releasing massive amounts of emissions that push up the temperature, including greenhouse gases such as carbon dioxide, warming aerosols such as black carbon & brown carbon and NMVOC (non-methane volatile organic carbon) and carbon monoxide that reduce the availability of hydroxyl, resulting in more methane and ozone in the atmosphere. 

[ NH sea surface temperature anomaly ]
At the same time, slowing down of the Atlantic Meridional Ocean Current (AMOC) can result in more ocean heat accumulating at the surface of the North Atlantic, as illustrated by the image on the right, from an earlier post.

As temperatures rise, increased meltwater runoff from Greenland and more icebergs moving south, in combination with stronger ocean stratification and stronger storms over the North Atlantic, can also cause a freshwater lid to form at the surface of North Atlantic that can at times enable a lot of hot water to get pushed abruptly underneath this lid toward the Arctic Ocean. The danger is that more heat will reach the seafloor and destabilize methane hydrates contained in sediments at the seafloor of the Arctic ocean. 

Ominously, very high methane levels continue to be recorded at Barrow, Alaska, as illustrated by the image below, adapted from NOAA.

The next few months will be critical as Arctic sea ice is sealing off the Arctic Ocean from the atmosphere, trapping heat underneath the ice and making it harder for ocean heat to get transferred from the Arctic Ocean to the atmosphere above the Arctic. Furthermore, sea ice is very thin, reducing the latent heat buffer that could otherwise have consumed ocean heat. 

The next danger is that the thin Arctic sea ice will rapidly retreat early next year as a warming Arctic Ocean will transfer more heat to the atmosphere over the Arctic, resulting in more rain and more clouds in the atmosphere over the Arctic, speeding up sea ice loss and further pushing up the temperature rise over the Arctic, as discussed at the feedbacks page, which also discusses how less Arctic sea ice can push up temperatures through the emissivity feedback. As temperatures rise over the Arctic, permafrost on land also threatens to thaw faster, threatening to cause huge releases of greenhouse gases, including carbon dioxide, methane and nitrous oxide. 


Meanwhile, emissions of greenhouse gases keep rising, further pushing up the temperature, as illustrated by the image below, from an earlier post.
  
Global energy-related greenhouse gas emissions 2000-2022, adapted from EIA ]
In the video below, Guy McPherson describes how temperature rise, loss of habitat and meltdown of nuclear power facilities each could result in rapid extinction of humans and many other species.


There are numerous further feedbacks that can accelerate the temperature rise and tipping points that can get crossed and cause even more abrupt rise of the temperature. One of these is the clouds tipping point that in itself can cause a temperature rise of 8°C, as discussed here.

Further feedbacks are also discussed at the Extinction page.  One further feedback is water vapor. A warmer atmosphere holds more water vapor, at a rate of 7% for each Degree Celsius the temperature rises. As temperatures keep rising, ever more water vapor will be sucked up by the atmosphere. This will also cause more droughts, reducing the ability of land to sustain vegetation and provide soil cooling through shading and through evaporation and formation of lower clouds, as discussed here. More water vapor in the atmosphere will also speed up the temperature rise because water vapor is a potent greenhouse gas.

The fact that such tipping points and feedbacks occur as greenhouse gas levels reach certain levels and as the temperature rise makes it critical to assess how fast greenhouse gas levels could rise and by how much the temperature has already risen. 

NASA data up through September 2023

The image below, adapted from NASA, shows that the September 2023 NASA Land+Ocean temperature was 1.78°C higher than it was in September 1923. The anomaly is 1.74°C when compared to a base centered around the year 1900 (1885-1915). The 1.74°C anomaly can be adjusted by 0.99°C to reflect a pre-industrial base, air temperature and higher polar anomalies (as shown in the box on the bottom right of the image), adding up to a potential anomaly of 2.73°C. 

[ click on images to enlarge ]
Indeed, earlier analysis such as discussed here, points out that the temperature may already have risen by more than 2°C (compared to pre-industrial) in 2015, when politicians pledged at the Paris Agreement to take action to combat the temperature rise to prevent this from happening. 

Blue: Polynomial trend based on Jan.1880-Sep.2023 data. 
Magenta: Polynomial trend based on Jan.2010-Sep.2023 data.
The above image is created with NASA Land+Ocean monthly mean global temperature anomalies vs 1885-1915, adjusted by 0.99°C to reflect ocean air temperature, higher polar anomalies and a pre-industrial base, and has trends added.  

Alarms bells have been sounding loud and clear for a long time, as discussed in posts such as this one, warning that the temperature could rise by more than 3°C by 2026. The above magenta graph shows how this could occur as early as next year (end 2024).

[ image from earlier post ]
[ image from the Extinction page ]
The above image illustrates the latent heat tipping point - estimated to correspond with a sea surface temperature anomaly of 1°C above the long term average (1901-1930 on the above image) - to get crossed and the seafloor methane tipping point - estimated to correspond with a sea surface temperature anomaly of 1.35°C - to get reached, as discussed in earlier posts such as this one, .

A Blue Ocean Event could occur as the latent heat and seafloor methane tipping points get crossed, and the ocean temperature keeps rising, as huge amounts of methane get released in the Arctic, as ever more heat keeps reaching and destabilizing methane hydrates contained in sediments at the seafloor of the Arctic Ocean, as discussed in many earlier posts such as this one.

Seafloor methane is one of many elements that could jointly cause a temperature rise of over 10°C, in the process causing the clouds tipping point to get crossed that can push up the temperature rise by a further 8°C, as illustrated by the image on the right, from the extinction page.

Conclusion

The precautionary principle should prevail and the looming dangers should prompt people into demanding comprehensive and effective action to reduce the damage and to improve the situation. 

To combat rising temperatures, a transformation of society should be undertaken, along the lines of this 2022 post in combination with a declaration of a climate emergency.


Links

• NASA - global maps

• NOAA - ENSO and Temperature bars

• The International Research Institute for Climate and Society, Columbia University Climate School
https://iri.columbia.edu/our-expertise/climate/forecasts/enso/current/?enso_tab=enso-sst_table

• Nullschool.net

• NSIDC - sea ice graph

• Zach Labe - Global sea ice - extent, concentration, etc.

• NASA - zonal means
https://data.giss.nasa.gov/gistemp/zonal_means

• Copernicus - Northern Hemisphere wildfires: A summer of extremes
https://atmosphere.copernicus.eu/northern-hemisphere-wildfires-summer-extremes

• NOAA - Barrow Atmospheric Baseline Observatory, United States
https://gml.noaa.gov/dv/iadv/graph.php?code=BRW&program=ccgg&type=ts

• Paul Beckwith - Accelerated Global Warming from Antarctic Sea Ice Collapse: Albedo, Latitude, Snow Cover on Ice…
https://www.youtube.com/watch?v=-5P1W4TrczQ

• Guy McPherson - College of Complexes Presentation (with Improved Audio) 

• NASA custom plots
https://data.giss.nasa.gov/gistemp/graphs_v4/customize.html

• Transforming Society


Friday, February 3, 2023

Dire situation gets even more dire

Antarctic sea ice extent was 1.788 million km² on February 21, 2023, an all-time low in the NSIDC record.

Antarctic sea ice area was 1,050,708 km² on February 22, 2023, as illustrated by the Nico Sun image below.


This means that a huge amount of heat that was previously reflected back into space by the sea ice is now instead absorbed by the Southern Ocean, in a self-reinforcing feedback loop that results in further sea ice loss, in turn further speeding up the temperature rise and making the weather ever more extreme.


Arctic sea ice extent was 14,271,000 km² on February 19, 2023, the third-lowest extent in the NSIDC record for the time of year, as illustrated by the above image.


Global sea ice extent reached a record low of 15,500,000 km² on February 11, 2023, as illustrated by the above image.

The situation is dire

The dire situation is further illustrated by the image below, showing high sea surface temperature anomalies (from 1981-2011) over the Southern Ocean, the Atlantic ocean and the Arctic Ocean on February 19, 2023. 


Given the dire situation regarding sea ice and sea surface temperatures, Arctic sea ice may fall dramatically later in the year.

Furthermore, emissions, ocean heat and greenhouse gas levels all keep rising. 

Carbon dioxide (CO₂) at Mauna Loa, Hawaii, reached a record average daily high of 422.88 parts per million (ppm) on February 28, 2023, as illustrated by the above image and the image below. 


It is remarkable for CO₂ levels to already reach record high levels this early in the year, given that CO₂ levels typically reach their annual maximum in May. This spells bad news for developments over the next few months. Keep in mind that carbon dioxide reaches its maximum warming some 10 years after emission, so we haven't been hit by the full wrath of carbon dioxide pollution yet.

Possibly even worse is the rise in methane. The image below shows NOAA globally averaged marine surface monthly mean methane data from 2016, with methane reaching 1923.57 parts per billion (ppb) in November 2022. A moving average centered over 12 months is added to highlight the acceleration in the rise in methane.


Accordingly, temperatures keep rising. An earlier analysis concludes that we have already exceeded the 2°C threshold set at the Paris Agreement in 2015.

These dire conditions spell bad news regarding the temperature rise to come, the more so since, on top of these dire conditions, there are a number of circumstances, feedbacks and further developments that make the outlook even more dire.

Circumstances that make the situation even more dire

Firstly, as illustrated by the image on the right, adapted from NOAA, we're moving into an El Niño.

It looks like it's going to be a very strong El Niño, given that we've been in a La Niña for such a long time.

Moving from the bottom of a La Niña to the peak of a strong El Niño could make a difference of more than half a degree Celsius, as illustrated by the image below, adapted from NOAA.

[ click on images to enlarge ]

Temperature anomalies can be very high during an El Niño. The February 2016 temperature on land-only was 2.96°C above 1880-1920, and in February 2020, it was 2.79°C higher, as illustrated by the image below, created with screenshots taken on February 15, 2023. Note that 1880-1920 isn't pre-industrial.


Secondly, sunspots look set to reach a very high maximum by July 2025, as illustrated by the next two images on the right, adapted from NOAA.

Observed values for January 2023 are already well above the maximum values that NOAA predicted to be reached in July 2025.

If this trend continues, the rise in sunspots forcing from May 2020 to July 2025 may well make a difference of more than 0.25°C, a recent analysis found.

Thirdly, the 2022 Tonga submarine volcano eruption did add a huge amount of water vapor to the atmosphere.

Since water vapor is a potent greenhouse gas, this is further contributing to speed up the temperature rise.

A 2023 study calculates that the submarine volcano eruption near Tonga in January 2022, as also discussed at facebook, will have a warming effect of 0.12 Watts/m² over the next few years.

The image below, created with NOAA data, shows Annual Northern Hemisphere Land Temperature Anomalies and has two trends added. The blue trend, based on 1850-2022 data, points at 3°C rise by 2032. The pink trend, based on 2012-2022 data, better reflects variables such as El Niño and sunspots, showing that this could trigger a huge rise, with 3°C crossed in 2024. Anomalies are from 1901-2000 (not from pre-industrial).


Feedbacks and developments making things worse

Indeed, a huge temperature rise could be triggered, due to a multitude of feedbacks and further developments that could strongly deteriorate the situation even further.

On top of the water vapor added by the Tonga eruption, there are several feedbacks causing more water vapor to get added to the atmosphere, as discussed at Moistening Atmosphere.

Further feedbacks include additional greenhouse gas releases such as methane from the seafloor of the Arctic Ocean and methane, carbon dioxide and nitrous oxide from rapidly thawing permafrost on land.

The image below shows the Northern Hemisphere Ocean Temperature Anomaly, compared to 1901-2000. The pink trend, based on 1850-2022 data, shows that the Latent Heat Tipping Point (at 1°C) was crossed in 2022, but the red trend, based on 2007-2022 data, better reflects variables such as El Niño and shows both the Latent Heat Tipping Point and the Seafloor Methane Tipping Point (at 1.35°C) getting crossed in 2024. 


Ominously, November 2023 temperature anomalies are forecast to be at the top end of the scale for a large part of the Arctic Ocean, as illustrated by the tropicaltidbits.com image below. 


Some developments could make things even worse and a huge temperature rise could unfold soon. The image below shows a polynomial trend added to NOAA globally averaged marine surface monthly mean methane data from April 2018 to November 2022, pointing at 1200 ppm CO₂e (carbon dioxide equivalent) getting crossed in 2027.

The Clouds Tipping Point, at 1200 ppm CO₂e, could be crossed and this on its own could result in a further rise of 8°C. As illustrated by the above image, this tipping point could be crossed as early as in 2027 due to forcing caused by the rise in methane alone. When further forcing is taken into account, this could happen even earlier than in 2027. 

On top of the February 28, 2023 daily average of 422.88 ppm for CO₂, methane can add 384.71 ppm CO₂e when using a 1-year GWP of 200 for NOAA's 1923.57 ppb November 2022 methane mean.

While methane at higher altitude can reach even higher levels than NOAA's marine surface data, adding NOAA's November 2022 mean to 422.88 ppm CO₂ would leave just 392.41 ppm CO₂e for further forcing, before the Clouds Tipping Point would get crossed, as the image on the right illustrates.

[ see the Extinction page ]
Further forcing comes from nitrous oxide and other greenhouse gases, while rises in other gases and further changes such as caused by sea ice loss and changes in aerosols can also speed up the temperature rise.

Changes in aerosols are discussed in earlier posts such as this post and this post. The upcoming temperature rise on land on the Northern Hemisphere could be so strong that much traffic, transport and industrial activity will grind to a halt, resulting in a reduction in cooling aerosols that are now masking the full wrath of global heating. These are mainly sulfates, but burning of fossil fuel and biomass also emits iron that helps photosynthesis of phytoplankton in oceans, as a 2022 study points out. 

Without these emissions, the temperature is projected to rise strongly, while there could be an additional temperature rise due to an increase in warming aerosols and gases as a result of more biomass and waste burning and forest fires.

The image on the right, from the extinction page, includes a potential rise of 1.9°C by 2026 as the sulfate cooling effect falls away and an additional rise of 0.6°C due to an increase in warming aerosols by 2026, as discussed in this post and earlier posts.

The image on the right indicates that the rise from pre-industrial to 2020 could be as much as 2.29°C. Earth's energy imbalance has grown since 2020. Therefore, the rise up to now may be higher. 

Climate Tipping Points and further Events and Developments

The temperature could also be pushed up further due to reductions in the carbon sink on land. An earlier post mentions a study that found that the Amazon rainforest is no longer a sink, but has become a source, contributing to warming the planet instead; another study found that soil bacteria release CO₂ that was previously thought to remain trapped by iron; another study found that forest soil carbon does not increase with higher CO₂ levels; another study found that forests' long-term capacity to store carbon is dropping in regions with extreme annual fires; another earlier post discussed the Terrestrial Biosphere Temperature Tipping Point, coined in a study finding that at higher temperatures, respiration rates continue to rise in contrast to sharply declining rates of photosynthesis, which under business-as-usual emissions would nearly halve the land sink strength by as early as 2040.

This earlier post also discusses how CO₂ and heat taken up by oceans can be reduced. A 2021 study on oceans finds that, with increased stratification, heat from climate warming less effectively penetrates into the deep ocean, which contributes to further surface warming, while it also reduces the capability of the ocean to store carbon, exacerbating global surface warming. A 2022 study finds that ocean uptake of CO₂ from the atmosphere decreases as the Meridional Overturning Circulation slows down. An earlier analysis warns about growth of a layer of fresh water at the surface of the North Atlantic resulting in more ocean heat reaching the Arctic Ocean and the atmosphere over the Arctic, while a 2023 study finds that growth of a layer of fresh water decreases its alkalinity and thus its ability to take up CO₂, a feedback referred to as the Ocean Surface Tipping Point.

[ from Blue Ocean Event 2022? - click on images to enlarge ]

The above image depicts only one sequence of events, or one scenario out of many. Things may eventuate in different orders and occur simultaneously, i.e. instead of one domino tipping over the next one sequentially, many events may occur simultaneously and reinforce each other. Further events and developments could be added to the list, such as ocean stratification and stronger storms that can push large amounts of warm salty water into the Arctic Ocean.

While loss of Arctic sea ice and loss of Permafrost in Siberia and North America are often regarded as tipping points, Antarctic sea ice loss, and loss of the snow and ice cover on Greenland, on Antarctica and on mountaintops such as the Tibetan Plateau could also be seen as tipping points. Another five tipping points are: 
- The Latent Heat Tipping Point
- The Seafloor Methane Tipping Point

Extinction

Altogether, the rise from pre-industrial to 2026 could be more than 18.44°C, while humans are likely to go extinct with a rise of 3°C, as illustrated by the image below, from an analysis discussed in an earlier post.


This should act as a warning that near-term human extinction could occur sooner than most may think. Indeed, when asked what could cause humans to go extinct, many may mention:
  1. asteroid strikes
  2. rampant pestilence, diseases, epidemics and pandemics
  3. war, murder and violence
  4. ecosystems and vegetation collapse, famine
  5. dehydration
  6. plastic pollution, spread of poisonous and toxic substances
  7. nuclear accidents, nuclear war or waste leakage
  8. outbreaks of antibiotic-resistant bacteria
  9. emerging new or re-emerging ancient microbes
10. bio-weapons and biological experiments gone out of hand
11. infertility, genetic degeneration, loss of genetic diversity
12. madness, cults, depression and suicide
13. polar shifts, earthquakes, landslides and tsunamis
14. Artificial Intelligence gone rogue
15. hostile aliens breeding predatory animals

More recently, climate change threats are mentioned such as:
16. destructive storms, flooding, fires and more extreme weather
17. hydrogen sulfide gas released from oceans
18. depletion of the ozone layer
19. co-extinctions, i.e. extinction of species that humans depend on, resulting in our own demise.

There may be more threats, but I think the biggest threat is:
20. temperature rise
In the video below, Edge of Extinction: Destination Destruction, Guy McPherson gives his view on our predicament.


Conclusion

The dire situation we're in looks set to get even more dire, calling for comprehensive and effective action, as described in the Climate Plan and Transforming Society.


Links

• NSIDC - National Snow and Ice Data Center
https://www.nsidc.org

• NSIDC - Chartic interactive sea ice graph
https://nsidc.org/arcticseaicenews/charctic-interactive-sea-ice-graph

• Cryosphere Computing - by Nico Sun
https://cryospherecomputing.com

• Nullschool
https://earth.nullschool.net

• Climate Reanalyzer - sea ice based on NSIDC index V3
https://climatereanalyzer.org/clim/seaice

• NOAA - greenhouse gases - trends

• NOAA - Climate Prediction Center - ENSO: Recent Evolution, Current Status and Predictions
https://www.cpc.ncep.noaa.gov/products/analysis_monitoring/lanina/enso_evolution-status-fcsts-web.pdf

• NOAA - Monthly temperature anomalies versus El Niño
https://www.ncei.noaa.gov/access/monitoring/monthly-report/global/202301/supplemental/page-4

• NOAA - Solar cycle progression

• NASA gistemp Monthly Mean Global Surface Temperature - Land Only

• NOAA - Annual Northern Hemisphere Land Temperature Anomalies 

• Tonga eruption increases chance of temporary surface temperature anomaly above 1.5 °C - by Stuart Jenkins et al. (2023)
https://www.nature.com/articles/s41558-022-01568-2


• Moistening Atmosphere
• Albedo, latent heat, insolation and more

• Latent Heat

• Blue Ocean Event

• Tropicaltidbits.com

• Methane keeps rising

• A huge temperature rise threatens to unfold soon

• The Clouds Feedback and the Clouds Tipping Point
https://arctic-news.blogspot.com/p/clouds-feedback.html

• Human Extinction by 2025?

• 2020: Hottest Year On Record

• The Importance of Methane in Climate Change

• The underappreciated role of anthropogenic sources in atmospheric soluble iron flux to the Southern Ocean - by Mingxu Liu et al. (2022)
https://www.nature.com/articles/s41612-022-00250-w

• How close are we to the temperature tipping point of the terrestrial biosphere? - by Katharyn Duffy et al. (2021)

• Overshoot or Omnicide? 

• Upper Ocean Temperatures Hit Record High in 2020 - by Lijing Cheng et al. (2021)

• Reduced CO₂ uptake and growing nutrient sequestration from slowing overturning circulation - by Yi Liu et al. (2022)
https://www.nature.com/articles/s41558-022-01555-7

• Cold freshwater lid on North Atlantic
• Long-Term Slowdown of Ocean Carbon Uptake by Alkalinity Dynamics - by Megumi Chikamoto et al. (2023) 
• Ocean Surface Tipping Point Could Accelerate Climate Change

• When Will We Die?

• Edge of Extinction: Destination Destruction - video by Guy McPherson


Thursday, December 15, 2022

Antarctic sea ice in rapid decline


Earlier this year, on February 25, Antarctic sea ice extent was at an all-time record low of 1.924 million km², as the above image shows. Throughout the year, Antarctic sea ice extent has been low. On December 14, 2022, Antarctic sea ice was merely 9.864 million km² in extent. Only in 2016 was Antarctic sea ice extent lower at that time of year, and - importantly - 2016 was a strong El Niño year.

The NOAA image on the right indicates that, while we're still in the depths of a persistent La Niña, the next El Niño looks set to strike soon.

Meanwhile, ocean heat content keeps rising due to high levels of greenhouse gases, as illustrated by the image on the right. 

Rising ocean heat causes sea ice to melt from below, resulting in less sea ice, which in turn means that less sunlight gets reflected back into space and more sunlight gets absorbed as heat in the ocean, making it a self-reinforcing feedback loop that further speeds up sea ice loss. 

The currently very rapid decline in sea ice concentration around Antarctica is illustrated by the animation of Climate Reanalyzer images on the right, showing Antarctic sea ice on November 16, November 29 and December 15, 2022.

In 2012, a research team led by Jemma Wadham studied Antarctica, concluding that an amount of 21,000 Gt or billion tonnes or petagram (1Pg equals 10¹⁵g) of organic carbon is buried beneath the Antarctic Ice Sheet, as discussed in an earlier post

The potential amount of methane hydrate and free methane gas beneath the Antarctic Ice Sheet could be up to 400 billion tonnes. 

The predicted shallow depth of these potential reserves also makes them more susceptible to climate forcing than other methane hydrate reserves on Earth, describes the news release

“We are sleepwalking into a catastrophe for humanity. We need to take notice right now. It is already happening. This is not a wait-and-see situation anymore," Jemma Wadham said more recently.

The animation on the right shows the thickness of Antarctic sea ice up to December 14, 2022, with 8 days of forecasts added.  

On December 29, 2022, Antarctic sea ice extent was at a record low for the time of the year, at 5.527 million km² (see image on the right). 

Recently, a study discovered a process that can contribute to the melting of ice shelves in the Antarctic, as discussed at the ArcticNews group

Ominously, high concentrations of methane have been recorded over Antarctica recently. The image below shows methane as recorded by the Metop-B satellite on November 28, 2022 pm at 399 mb. 

Global sea ice extent was also at a record low for the time of year on December 29, 2022, at 17.53 million km², as illustrated by the image below, by the National Institute of Polar Research, Japan


The situation is dire and the right thing to do now is to help avoid or delay the worst from happening, through action as described in the Climate Plan.


Links

• NSIDC - Interactive sea ice graph
https://nsidc.org/arcticseaicenews/charctic-interactive-sea-ice-graph

• NOAA - ENSO: Recent Evolution, Current Status and Predictions
https://www.cpc.ncep.noaa.gov/products/analysis_monitoring/lanina/enso_evolution-status-fcsts-web.pdf

• NOAA - ocean heat content
https://www.ncei.noaa.gov/access/global-ocean-heat-content/index.html

• Climate Reanalyzer sea ice concentration
https://climatereanalyzer.org/wx/todays-weather/?var_id=seaice-snowc&ortho=7&wt=1

• Naval Research Laboratory - Antarctic sea ice 
https://www7320.nrlssc.navy.mil/GLBhycomcice1-12/antarc.html

• Potential methane reservoirs beneath Antarctica - Press release University of Bristol (2012)
https://www.bristol.ac.uk/news/2012/8742.html

• Potential methane reservoirs beneath Antarctica - by Jemma Wadham et al. (2012)
https://www.nature.com/articles/nature11374

• A new frontier in climate change science: connections between ice sheets, carbon and food webs

• Ocean variability beneath Thwaites Eastern Ice Shelf driven by the Pine Island Bay Gyre strength - by Tiago Dotto et al.
https://www.nature.com/articles/s41467-022-35499-5

• Metop-B satellite readings

• National Institute of Polar Research, Japan
• Climate Plan
https://arctic-news.blogspot.com/p/climateplan.html


Tuesday, February 22, 2022

Albedo loss in Antarctica


As above image shows, Antarctic sea ice extent was only 1.973 million km² on February 23, 2022, the lowest on record since satellite measurements began in 1979.


Earlier, on February 20, 2022, Antarctic sea ice extent was only 1.983 million km². On February 20, 2008, it was 3.783 million km². That's a difference of 1.8 million km², or some 0.36% of the total surface of Earth (which is 510,072,000 km²).


As illustrated by above image, adapted from IPCC AR5, incoming solar radiation at Top Of Atmosphere (TOA) is 340.4 W/m². This 340.4 W/m² is an average. The value varies depending on the seasons, i.e. the more the surface of Earth is facing the Sun, the higher this value will be (see image below, from the insolation page). 

                     The June Solstice in 2021 occurred on June 21, 2021.
Another variable is how many clouds and aerosols are in the sky. Much of this radiation can be reflected or absorbed by the atmosphere and some of the radiation that reaches the surface can also be reflected. Yet, on a cloud-free day, where the sky is clear from aerosols, much of the incoming solar radiation will reach the surface. It further depends on the albedo of the surface, how much will in the end be absorbed or reflected at the surface.

[ from the Albedo page ]

Albedo refers to the reflectivity of the surface. Earth average albedo is 0.3 or 30%. The albedo of sea ice can be as high as 0.9 (i.e. 90% when covered with fresh snow). Currently, albedo of the sea ice is about 0.6 (the sea ice is partly covered with melt pools). Open water has an albedo of 0.06. So, disappearance of the sea ice makes an albedo difference of at least 0.5.

So, when taking half of 340 W/m² and multiplying this by 0.36% (i.e. the part of Earth's surface), that gives a radiative forcing of 0.612 W/m². That would mean that some 0.612 W/m² that was previously reflected (Feb 20, 2008) is now instead absorbed by the ocean (on Feb 20, 2022). If Antarctic sea ice would disappear altogether, that would correspond to another loss of some 0.612 W/m², and together with the difference between 2008 and 2022, that would add up to a total radiative forcing of 1,224 W/m².

That's almost half as much as all human-caused global warming in 2019. As the image below shows, radiative forcing was 2.72 W/m² in 2019 relative to 1750, according to IPCC AR6


If anyone can add to or improve the above calculation, please add a comment (see box below). 

The situation is dire and calls for the most comprehensive and effective action, as described at the Climate Plan.


Links

• NSIDC - Charctic interactive Sea Ice Graph
https://nsidc.org/arcticseaicenews/charctic-interactive-sea-ice-graph

• Wikipedia - Earth
https://en.wikipedia.org/wiki/Earth

• IPCC - Figure 2.11 (AR5/WG1/Chapter 2)
https://www.ipcc.ch/report/ar5/wg1/observations-atmosphere-and-surface/fig2-11_orig-pptx-2

• The global energy balance from a surface perspective - by Martin Wild et al. (2012)

• NASA - Earth albedo

• Albedo

• Insolation

• IPCC AR6 WG1 SPM

• Climate Plan
https://arctic-news.blogspot.com/p/climateplan.html